
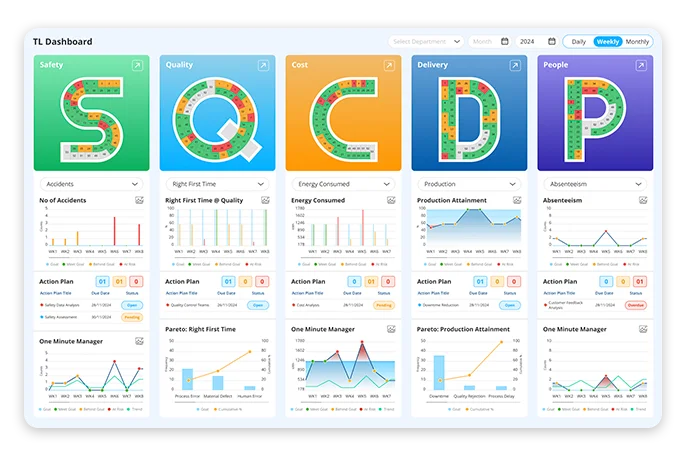
In the context of Lean manufacturing, SQDCP refers to Safety, Quality, Delivery, Cost, and People. SQDCP visual management tool tracks and shows performance in real time, empowering teams to drive continuous improvement and align with strategic goals.
How SQDCP boards support Lean manufacturing goals
- Real-time production tracking: Track your SQDCP metrics daily using live dashboards. Eliminate delays in reporting by receiving instant insights into performance areas like Safety, Quality, Delivery, Cost, and People.
- Continuous improvement: SQDCP boards spots bottlenecks and recurring visual trend data. Use performance dashboards to take immediate corrective actions and drive ongoing process optimisation.
- Transparent operations: Ensure leaders, team members, and stakeholders share the same performance view with tiered daily meeting boards. Digital boards promote accountability and empower teams to act faster with fact-based insights.
A practical guide to each performance metric
Explore how each SQDCP metric is analysed in SQDCP process software:
- Safety
- Shows incidents and near-miss reports
- Highlights overdue safety actions and root causes
- Displays trends by shift, cell, or department
- Tracks closure rates to ensure accountability
- Quality
- Spotlights daily defects by type or station
- Tracks First Pass Yield (FPY) and rework volumes
- Displays trends by shift, batch, or product line
- Ensure continuous quality improvement with live data
- Delivery
- Track on-time delivery performance (OTIF)
- Improve warehouse and inventory management
- Streamline logistics operations for timely deliveries
- Analyse stock movement trends for better forecasting
- Cost
- Monitors cost per unit, downtime losses, and rework cost
- Underlines overspend triggers by shift, process, or material
- Visualises cost trends across departments
- Improve budget management and resource allocation
- People
- Observes skill matrix updates and training completion
- Flags capability gaps by team, line, or shift
- Tracks team alignment with strategic goals
- Measures engagement through visual performance indicators
Step-by-step guidance to use SQDCP board daily
Step 1: Define relevant KPIs
Determine the essential manufacturing KPIs or operational metrics important to your industry.
Step 2: Setting up digital SQDCP board
Instead of depending on manual whiteboards, leverage a digital SQDCP board software like Data Point for live performance.
Step 3: Conduct daily stand-up meetings
Use the SQDCP visual management board during daily huddles to assess performance and spot bottlenecks.
Step 4: Use visual indicators for quick insights
A well-structured SQDCP dashboard should include colour coded indicators, trend charts and action logs.
Step 5: Analyse trends and implement continuous improvement
Detect the patterns and repeating problems and take corrective actions based on the data-driven insights, cultivating a culture of Lean manufacturing and operational excellence.
Step 6: Integrate with other business systems
Integrate with the other systems like ERP or MES systems or lean tools for enhanced efficiency.
LTS Data Point: Choose your best SQDCP board
LTS Data Point enables organisations to run SQDCP boards digitally with clarity, speed, and consistency. By consolidating all key performance indicators into a single live environment, it connects high-level objectives directly to day-to-day execution on the shop floor and beyond.
Designed to support Lean ways of working, the platform replaces manual updates with visual, real-time dashboards that pull data directly from ERP and MES systems. Proven performance frameworks – including SQDCP and the Balanced Scorecard – are embedded, ensuring metrics remain structured, aligned, and actionable.
The result is faster decision-making, stronger accountability, and a standardised approach to continuous improvement that scales across teams and locations.