

Most “halving sites” are basically alarm clocks. They tell you when something might happen, then hope you fill in the meaning bitcoin halving. That’s fine for a quick check, but it’s weak for understanding a four-year supply schedule.
That’s why I like BTBJB as a concept. It treats the halving as a system you can measure, not a date you can worship. And once you start thinking that way, a countdown becomes the first step, not the whole product.
What the Halving Really Is
A Bitcoin halving is not a calendar event. It’s a protocol rule that triggers at a specific block height, roughly every 210,000 blocks. The block subsidy drops by half, and the issuance pace slows. That’s the “scarcity story” in plain language.
But the market story is messier. People want a simple script: countdown hits zero, price goes vertical. Reality has chapters, not a single punchline. If you only stare at the timer, you miss the context that shapes expectations, fear, and patience.
Think of it like a movie trailer. It sets a mood, but it can’t replace the whole film. The halving is the trailer. The cycle is the film.
The Bitcoin Halving Countdown Section You Actually Need
What “bitcoin halving countdown” should mean
A bitcoin halving countdown answers one honest question: “How long until the next subsidy cut, based on blocks left?” It’s a planning tool. It’s also a reality check, because it forces you to think in blocks, not headlines.
The important detail is that the “date” is always an estimate. Blocks don’t arrive like trains. Some days run fast, others crawl. The countdown is a living forecast, not a fixed appointment.
Why the countdown is always an estimate
Bitcoin adjusts mining difficulty, and hash rate moves. Those two forces change the average block interval. So any countdown that pretends to be exact is selling confidence it doesn’t own.
A solid countdown should be transparent about inputs. It should say what block you’re on, what target height you’re aiming for, and what assumptions drive the ETA. BTBJB does this in a straightforward way, and it also explains why dates can shift.
A “good” countdown shows more than time
If all you show is “days left,” you’re hiding the mechanism. A more useful layout includes: current block height, next halving height, blocks remaining, ETA, recent average block time, and the subsidy change.
On BTBJB, you can also connect the countdown to supply math. The site highlights the current subsidy (3.125 BTC) and the next one (1.5625 BTC), so users see what “halving” literally changes.
Beyond the Timer: The Data Modules That Turn Curiosity Into Clarity
Supply math that feels concrete, not mystical
Scarcity talk gets vague fast. So it helps when a tool translates it into simple daily and annual issuance. BTBJB gives a subsidy-based estimate and even lets you adjust the assumed block time. At roughly 10 minutes per block, it frames issuance around ~450 BTC/day now, and ~225 BTC/day after the next halving.
That’s not a price prediction. It’s a clean input into your own thinking. It also helps you explain the halving to someone who doesn’t care about crypto jargon.
Inflation views that invite comparisons, with guardrails
Another strong move is treating “inflation” as new supply inflation, not consumer prices. BTBJB shows an annualized supply inflation estimate around 0.82% now, and ~0.41% after the next halving (using its subsidy issuance model).
It also compares Bitcoin’s supply inflation with rough reference values for gold supply growth and USD CPI inflation. The site is careful to warn these are different definitions, and the comparison is for intuition. That honesty matters.
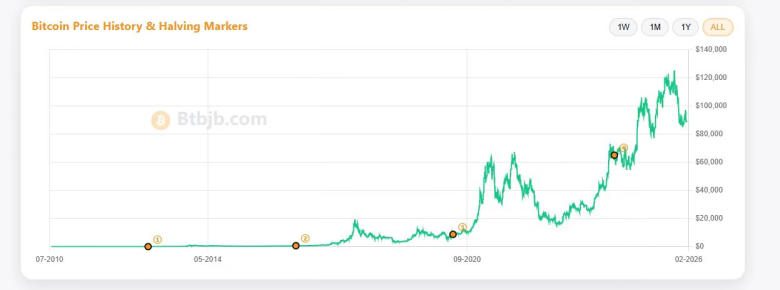
Visual context that keeps you from overfitting one narrative
The best halving tools don’t just shout “cycle!” They let you overlay eras, zoom timelines, and explore outcomes without forcing a single conclusion. Even if you end up bullish, you get there through evidence and range-thinking.
Here’s a simple example. Imagine you’re writing a blog post on “2028 halving expectations.” A plain countdown gives you a date. A data hub gives you charts and distributions you can cite, plus the humility that comes with seeing variability.
The “human” metrics: time, pain, and recovery
Most people don’t think in percent returns. They think in time and stress. “How long until I’m green again?” “How bad can a drawdown feel?” Those are emotional questions that deserve data-based answers.
This is where a research-style hub becomes practical. It helps you set expectations for volatility and patience, instead of feeding you one heroic storyline. You don’t need to be a quant. You just need clear visuals and honest framing.
Who This Kind of Halving Hub Is For
If you’re new, the countdown is your entry point. You learn the block-height logic, see the subsidy change, and stop treating the halving like a holiday. Then you graduate to supply and inflation views, which are easier to understand than “technical analysis.”
If you’re more advanced, the value is speed and structure. You can sanity-check narratives, pull numbers for research notes, and compare frameworks without opening twelve tabs. And if you’re a creator, it’s a goldmine for clean explanations that don’t sound like hype.
Closing Thought
A countdown can be fun. It’s a little ritual, like crossing days off a calendar. But the halving is bigger than a timer. It’s a slow, mechanical change that reshapes supply, expectations, and long-term incentives.
So yes, keep your bitcoin halving countdown. Just don’t stop there. Use it as the doorway into the actual story—measurable, debatable, and far more interesting than a single number hitting zero.